
On Friday, March 22nd, 2019, Amazon.com, Inc. stock price opened at $1810.17 per share and reached to 1818.98, but closed at 1763.11. At the end of the day, the stock was down 3%.
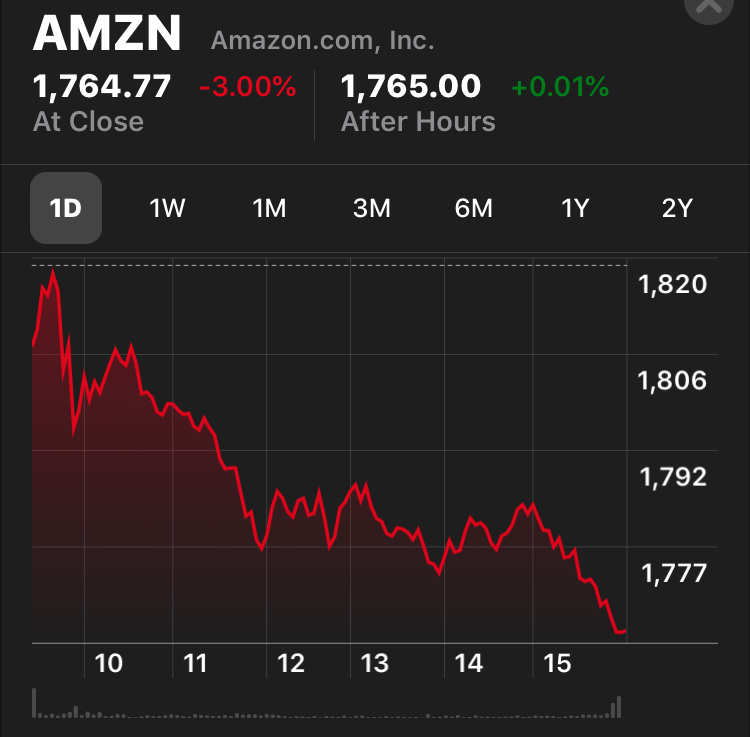
(Source: Yahoo Finance)
What does it mean?
An unlucky investor, who invested a day before may think that he/she has made a mistake. However, a potential investor, who is waiting to buy it may think that he/she has made a sensible decision.
Like many common investors, I personally struggled to make sense of the daily stock erratic movement.
Also, it is not uncomon that the Wall Street graciously try to give meaning to the ups and down of the market price.
Seeing all the blood red graph, we presume that the world is falling apart and our psychology instructs us to act now. This is an animal spirit which is built within us humans. Our gene is tuned to act in a way to comfort us psychologically, which is very bad for our investment.
What is the correct way?
I think, instead of trying to give meaning to the stock movement and labeling our smartness based on the daily stock price fluctuation, we have to zoom out 2,3, or 5 years and see the big picture.
This is what the two-year stock performance graph for Amazon.com Inc. looks like. It doesn’t look like the world is ending.

Two-year View of Amazon.com Inc Stock Price
(Source: Yahoo Finance)
If you look at the five-year view, it looks like the current market downshift is just a blip and soon to be corrected. Keep in mind that it has done so plenty of times in the past.
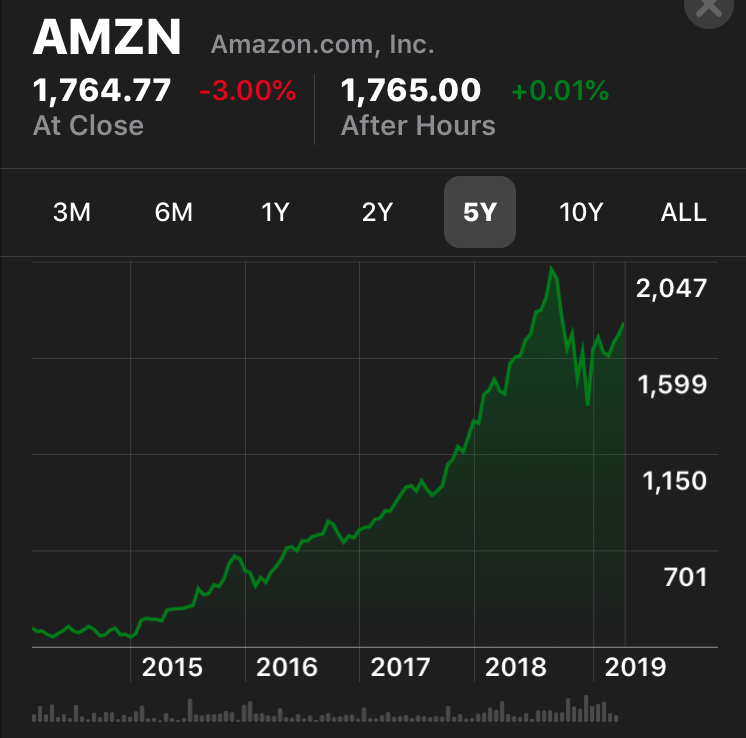
Five-year View of Amazon.com Inc Stock Price
(Source: Yahoo Finance)
As long as the fundamentals of the Amazon business are great, the stock will gradually march upward.
Therefore, for sensible investors, it is necessary to ignore the daily market fluctuation. I know, it is hard! But, keep the two-year view as your default view and you will do better.
All time view (below).
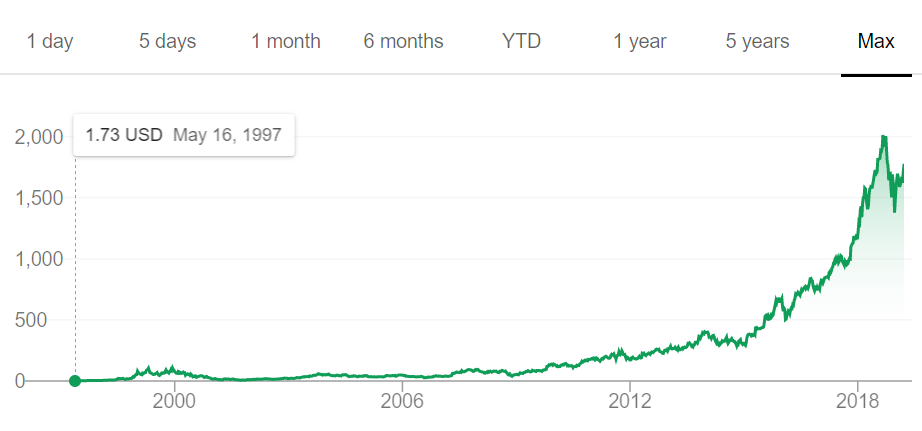
Albeit, refrain from zooming out too far like 10 years or more. I believe, it is erroneous to look that back. Pretty sure the company has changed a lot since and don’t delude your vision.
Disclaimer: Long Position.
