FY21 Q3 highlights:
- Net sales increased 15% to $110.8 billion in the third quarter, compared with $96.1 billion in third quarter 2020.
- Net income decreased to $3.2 billion in the third quarter, or $6.12 per diluted share, compared with $6.3 billion, or $12.37 per diluted share, in third quarter 2020.
Revenue per share and EPS growth since 2016. The growth rate has slowed but there is no sign of stopping.

Here is the breakdown-
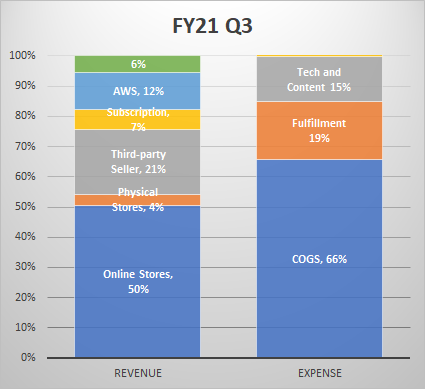
Year over Year comparison of sales mix.

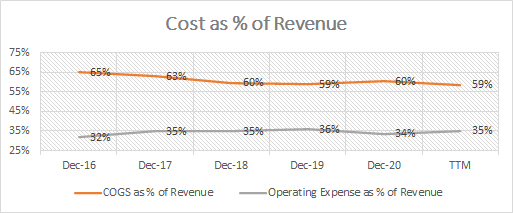
Profitability trend.
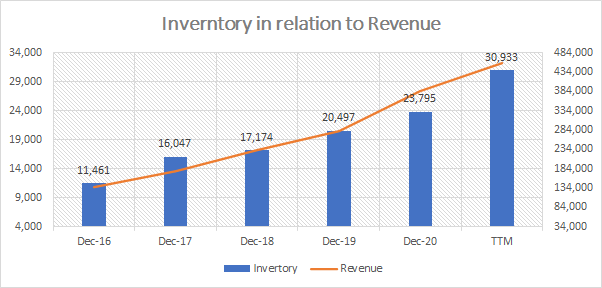
A quick look at the inventory and revenue trend.

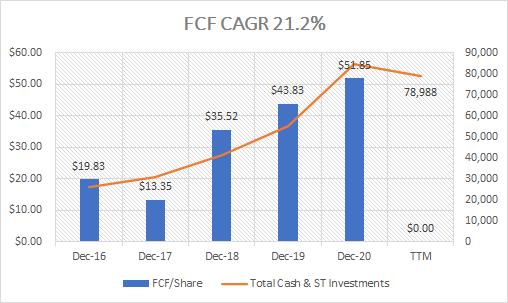
Free Cash Flow and Total Cash trend:
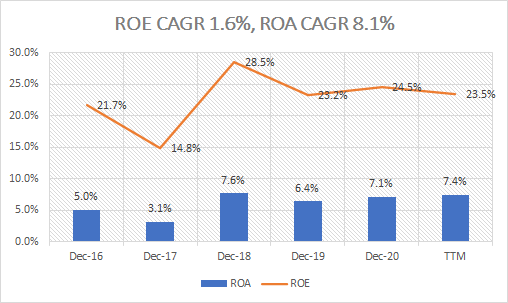
Return on Equity and Return on Assets by year.
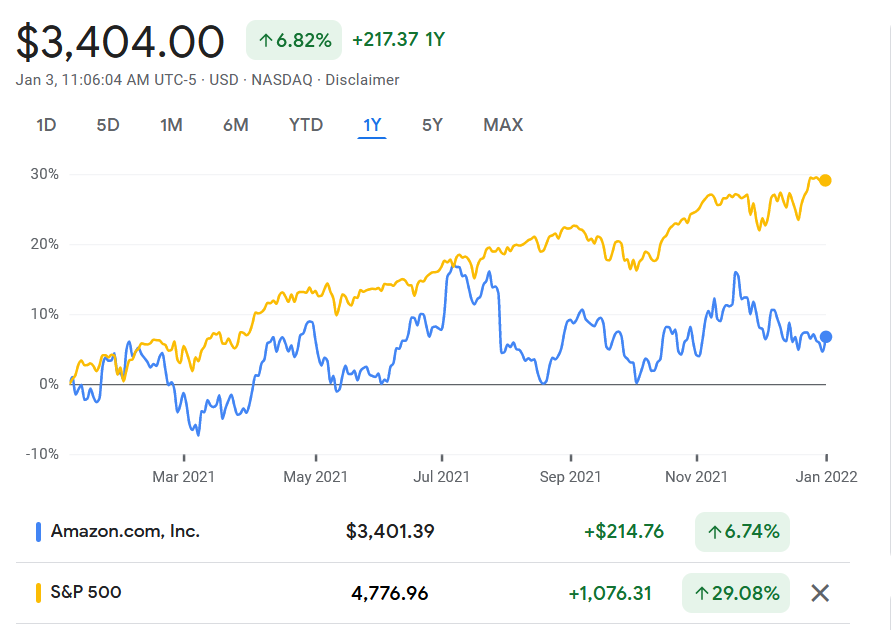
Amazon seems quite expensive at current price. It’s market capitalization is $1.7 trillion. It trades at the PE ratio of 66.5. In fact, it always has traded at this expensive earnings multiplier. Performance wise, in 2021, it clearly lagged the SP500 index. See below. Perhaps, it’s stock price has to wait until its earnings catch-up.